EEG Data Resource: Medicine / MedTech
Purpose: This page helps people research and understand electroencephalogram (EEG) data, what information can be extracted from it, and what insights a motivated user can gain.
Raw EEG Data
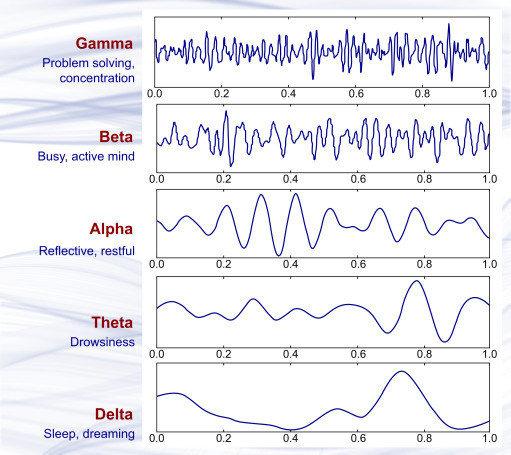
This is a visualization of what brainwaves look like at different frequencies on an EEG. Each line represents electrical activity recorded from a different electrode on the brain. At this stage, the data is not interpreted, it simply shows voltage changes over time.
Raw EEG data is the foundation of all EEG analysis. While it can appear confusing at first, patterns become clearer with experience. This raw signal is later transformed into more interpretable visualizations.
Information Extracted from EEG Data
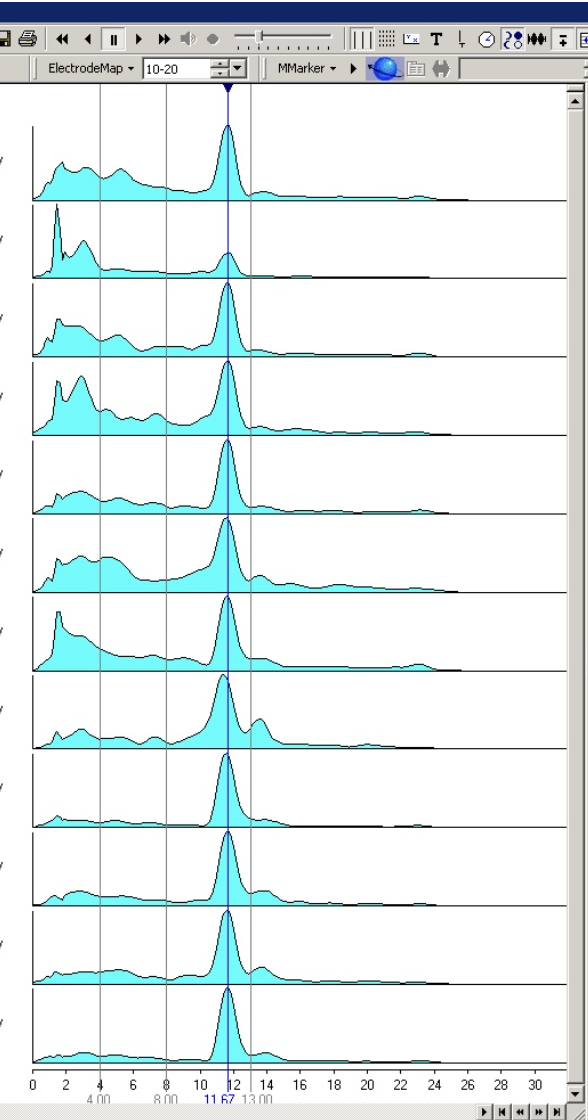
One common visualization derived from EEG data is the Individual Alpha Frequency (IAF). IAF represents a person's unique peak frequency within the alpha band (8-13 Hz) and is associated with how quickly they process information.
Each electrode can display its own frequency peak, allowing analysts to observe differences across brain regions. This visualization is created by processing raw EEG data rather than directly observing it.
EEG Heat Maps
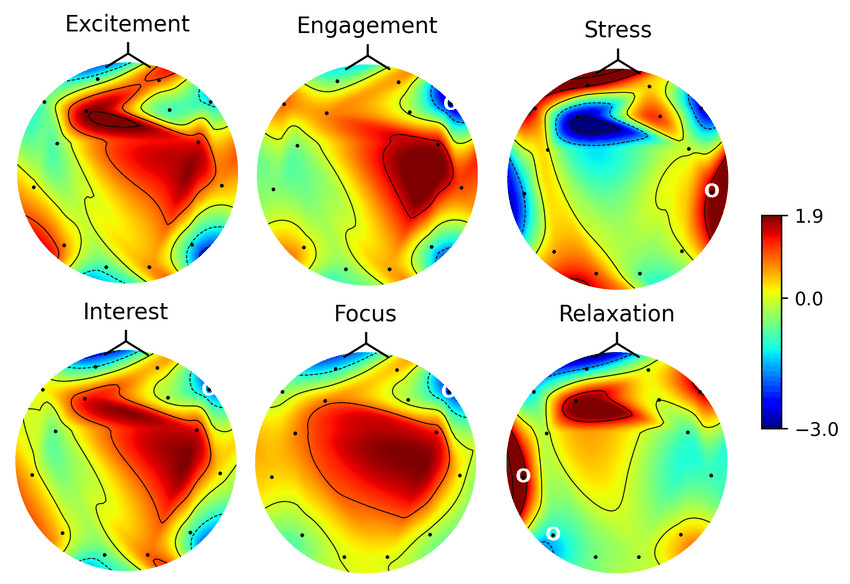
Heat maps are another visualization derived from EEG data. Warm colors represent higher electrical activity, while cooler colors indicate lower activity. These maps can highlight abnormal patterns in the brain.
EEG heat maps are useful in diagnosing epilepsy, sleep disorders, and internal brain injuries. They can also be used to visualize emotional or mental states such as focus, stress, or relaxation.
Patterns and Meaning
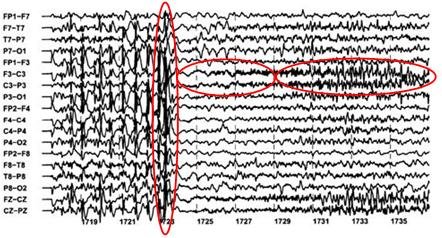
Certain EEG patterns indicate neurological events such as seizures. The elongated, high-amplitude spikes shown here are characteristic of seizure activity rather than simple motion artifacts.
The concentration of activity in frontal electrodes suggests that the seizure originates in the frontal lobe, which is critical information for diagnosis and treatment planning.
EEG Action Items
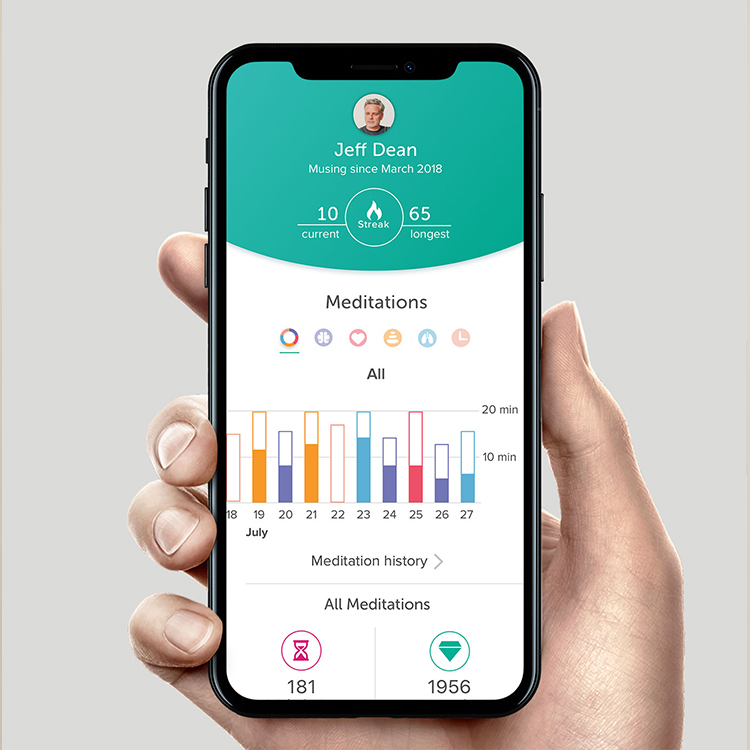
EEGs are not only used in clinical settings. Consumer EEG devices, such as Muse, analyze brain activity to detect stress patterns and guide users toward relaxation through sound and music-based feedback.
Suggestions for Improvement
- Automate EEG data processing instead of relying on manual analysis.
- Generate heat maps and frequency charts in real time.
- Add interactive tools such as frequency sliders to isolate brainwave bands.
- Create EEG-based mood tracking over time.